The Pennsylvania State University, Spring 2021 Stat 415-001, Hyebin Song
Introduction
IntroductionIntroduction to Statistical InferenceLearning objectivesStatistics Some definitionsRelationship between probability and statisticsParametric and distribution-free modelsOverview of this course
Introduction to Statistical Inference
Learning objectives
- Understand the relationship between probability and statistics
- Understand basic terminology in statistics
Statistics
Statistics is a data-driven science that concerns the extraction of useful information from the observed data in a principled way, accounting for uncertainty in the observed data.
Example 1
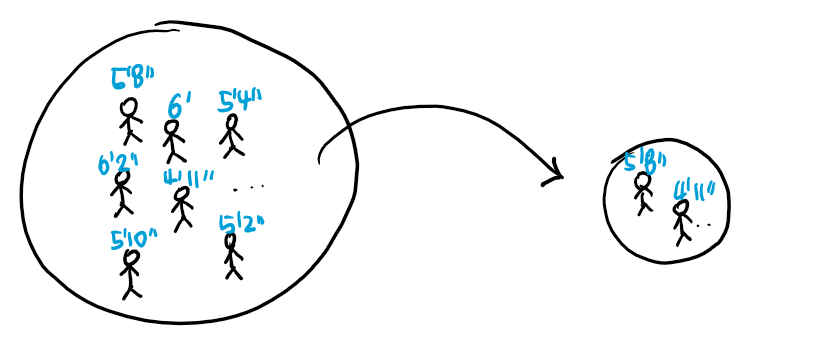
Goal: understand an average height of all PSU Students (40K)
Procedure:
- Ask 100 PSU students their heights and record the responses
- Compute an average of 100 height values
- Claim that this computed average should be close to the average height of all PSU Students

Some definitions
| Term | Definition |
|---|---|
| Population | the target of our inferential interest |
| Sample | a random fraction of the population (usually from n independent trials from a random experiment) |
| Parameter | a numerical summary of the population. Denoted by Greek letters . |
| Statistic | a numerical summary of the sample . A function of the sample which does not depend on any unknown parameters. |
| Estimator | a statistic designed to infer a specific parameter . Denoted as or . |
| Estimate | a realization of an estimator. Usually denoted using lower-case letters. |
Example 1 (Continued)
- Population: collection of all heights from PSU students
- Sample: . A random vector of size 100
- Parameter of interest: .
- Estimator: .
- Estimate: .
Example 2
Goal: understand the probability of face "1" in a biased die
Procedure:
- Toss the die 1000 times and record the outcomes.
- Compute the average proportion of "1" among 1000 trials
- Argue that the computed proportion is close to the true probability of outcome "1".
In this example,
- population: probability of outcome 1,...,6 of the die.
- parameter of interest: = probability of outcome 1
- sample: a random vector of size 1000 where : = ith toss outcome
- estimator of : a sample proportion
- estimate of : a realized sample proportion
Relationship between probability and statistics
Given , what is the probability that the number of heads among 20 tosses?
Model: ). i.i.d.
Predict data:
Given (), what is the true probability of head?
Data: where each .
Infer a model:
- Since each , assume , i.i.d.
- Using , we make a guess about , and argue with .
Parametric and distribution-free models
Parametric models: assume that the distribution of each observation is known up to a parameter.
Example: , , ...
Distribution-free models: do not make an assumption on the distribution of a sample.
Remark 1. The problem of inferring a model reduces to inferring a parameter value.
Remark 2. In this class, we will mostly focus on parametric models.
Overview of this course
Suppose we have an observed sample where each is assumed to be from a parametric distribution with an unknown parameter .
| Topic | Goal |
|---|---|
| Point Estimation | Provide the best guess of based on the observed sample |
| Interval Estimation | Provide an interval which is likely to include based on the observed sample |
| Hypothesis Testing | Make a decision about a statement about the parameter based on the observed sample |